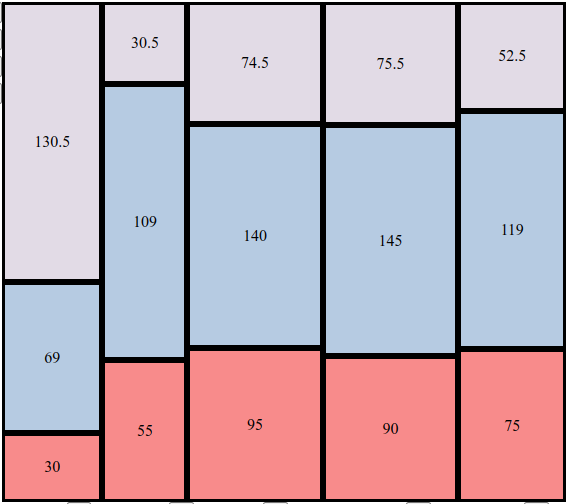
Marimekko Chart Generator
Free tool for making Marimekko charts. No signup required (or possible).
Tip: Click on labels to edit them!
I first heard of Marimekko (Mekko) charts from Tim Ferris' interview with Nick Kokonas. The context was presenting financial data (ingredient costs) to a non-financial audience (chef) that needs to make critical business decisions. Failing to really understand what they were (somehow didn't find the Wikipedia page first), and then failing to find any interactive examples, I decided to write my own.
Now I get that they are simply stacked bar charts where all bars have the same height; that information is expressed in the bar (column) width instead. Super not convinced that visualizing data this way is actually an effective way to convey meaning.
Very fun to work on though - send feedback if there are changes that would make it more useful to you!
Built with Dioxus (Rust -> WASM) which beat out the similar Leptos for
- getting me to global contexts faster
- native Rust flow control in rsx snippets